こんにちは。産婦人科医のtommyです(Twitter:@obgyntommy)。
この記事では、ワインのデータセットを用いた教師あり機械学習の一通りの流れをscikit-learnを用いて学びます。
教師あり機械学習の一般的な流れは以下の通りです。
教師あり学習の機械学習の流れ
- データセットの読み込み
- データの前処理
- 探索的データ解析(EDA;Explanatory Data Analysis)
- 機械学習予測モデルの作成
- 性能評価
scikit-learnを用いた機械学習の流れについては、以下の記事を参照して下さい。
-

【機械学習】scikit-learnの使い方【基礎から全て解説】
続きを見る
又、Google Colaboratoryの使い方については以下の記事を参照して下さい。
-

Google Colaboratoryの使い方【完全マニュアル】
続きを見る
尚、ワインのデータセットを用いた教師なしの機械学習についてはこちらの記事をご参照下さい。
-

説明可能なAIとは|Explainable AIについて学ぶべきこと
続きを見る
では早速、1つ1つ確認していきましょう。
Wineデータセットの読み込みと内容確認

記事を読まなくても、こちらのGooogle Colaboratoryの共有ファイルで確認出来ますので参照されて下さい。
scikit-learnのライブラリから「wine」のデータセットを読み込みます。
wineのデータセットは典型的な多値分類のデータセットです。アルコール量やマグネシウム量などの成分のデータから、ワイン3種の分類を行うためのデータセットになります。
wineデータセット(https://scikit-learn.org/stable/modules/generated/sklearn.datasets.load_wine.html) の中身を確認します
In[]
1 2 3 | from sklearn.datasets import load_wine data_wine = load_wine() data_wine |
Out[]
1 2 3 4 5 6 7 8 9 10 11 12 13 14 15 16 17 18 19 20 21 22 23 24 25 26 27 28 29 30 31 32 33 34 35 36 37 38 39 40 41 42 43 44 45 46 | {'DESCR': '.. _wine_dataset:\n\nWine recognition dataset\n------------------------\n\n**Data Set Characteristics:**\n\n :Number of Instances: 178 (50 in each of three classes)\n :Number of Attributes: 13 numeric, predictive attributes and the class\n :Attribute Information:\n \t\t- Alcohol\n \t\t- Malic acid\n \t\t- Ash\n\t\t- Alcalinity of ash \n \t\t- Magnesium\n\t\t- Total phenols\n \t\t- Flavanoids\n \t\t- Nonflavanoid phenols \n \t\t- Proanthocyanins\n\t\t- Color intensity\n \t\t- Hue\n \t\t- OD280/OD315 of diluted wines \n \t\t- Proline\n\n - class:\n - class_0\n - class_1\n - class_2\n\t\t\n :Summary Statistics:\n \n ============================= ==== ===== ======= =====\n Min Max Mean SD\n ============================= ==== ===== ======= =====\n Alcohol: 11.0 14.8 13.0 0.8\n Malic Acid: 0.74 5.80 2.34 1.12\n Ash: 1.36 3.23 2.36 0.27\n Alcalinity of Ash: 10.6 30.0 19.5 3.3\n Magnesium: 70.0 162.0 99.7 14.3\n Total Phenols: 0.98 3.88 2.29 0.63\n Flavanoids: 0.34 5.08 2.03 1.00\n Nonflavanoid Phenols: 0.13 0.66 0.36 0.12\n Proanthocyanins: 0.41 3.58 1.59 0.57\n Colour Intensity: 1.3 13.0 5.1 2.3\n Hue: 0.48 1.71 0.96 0.23\n OD280/OD315 of diluted wines: 1.27 4.00 2.61 0.71\n Proline: 278 1680 746 315\n ============================= ==== ===== ======= =====\n\n :Missing Attribute Values: None\n :Class Distribution: class_0 (59), class_1 (71), class_2 (48)\n :Creator: R.A. Fisher\n :Donor: Michael Marshall (MARSHALL%PLU@io.arc.nasa.gov)\n :Date: July, 1988\n\nThis is a copy of UCI ML Wine recognition datasets.\nhttps://archive.ics.uci.edu/ml/machine-learning-databases/wine/wine.data\n\nThe data is the results of a chemical analysis of wines grown in the same\nregion in Italy by three different cultivators. There are thirteen different\nmeasurements taken for different constituents found in the three types of\nwine.\n\nOriginal Owners: \n\nForina, M. et al, PARVUS - \nAn Extendible Package for Data Exploration, Classification and Correlation. \nInstitute of Pharmaceutical and Food Analysis and Technologies,\nVia Brigata Salerno, 16147 Genoa, Italy.\n\nCitation:\n\nLichman, M. (2013). UCI Machine Learning Repository\n[https://archive.ics.uci.edu/ml]. Irvine, CA: University of California,\nSchool of Information and Computer Science. \n\n.. topic:: References\n\n (1) S. Aeberhard, D. Coomans and O. de Vel, \n Comparison of Classifiers in High Dimensional Settings, \n Tech. Rep. no. 92-02, (1992), Dept. of Computer Science and Dept. of \n Mathematics and Statistics, James Cook University of North Queensland. \n (Also submitted to Technometrics). \n\n The data was used with many others for comparing various \n classifiers. The classes are separable, though only RDA \n has achieved 100% correct classification. \n (RDA : 100%, QDA 99.4%, LDA 98.9%, 1NN 96.1% (z-transformed data)) \n (All results using the leave-one-out technique) \n\n (2) S. Aeberhard, D. Coomans and O. de Vel, \n "THE CLASSIFICATION PERFORMANCE OF RDA" \n Tech. Rep. no. 92-01, (1992), Dept. of Computer Science and Dept. of \n Mathematics and Statistics, James Cook University of North Queensland. \n (Also submitted to Journal of Chemometrics).\n', 'data': array([[1.423e+01, 1.710e+00, 2.430e+00, ..., 1.040e+00, 3.920e+00, 1.065e+03], [1.320e+01, 1.780e+00, 2.140e+00, ..., 1.050e+00, 3.400e+00, 1.050e+03], [1.316e+01, 2.360e+00, 2.670e+00, ..., 1.030e+00, 3.170e+00, 1.185e+03], ..., [1.327e+01, 4.280e+00, 2.260e+00, ..., 5.900e-01, 1.560e+00, 8.350e+02], [1.317e+01, 2.590e+00, 2.370e+00, ..., 6.000e-01, 1.620e+00, 8.400e+02], [1.413e+01, 4.100e+00, 2.740e+00, ..., 6.100e-01, 1.600e+00, 5.600e+02]]), 'feature_names': ['alcohol', 'malic_acid', 'ash', 'alcalinity_of_ash', 'magnesium', 'total_phenols', 'flavanoids', 'nonflavanoid_phenols', 'proanthocyanins', 'color_intensity', 'hue', 'od280/od315_of_diluted_wines', 'proline'], 'target': array([0, 0, 0, 0, 0, 0, 0, 0, 0, 0, 0, 0, 0, 0, 0, 0, 0, 0, 0, 0, 0, 0, 0, 0, 0, 0, 0, 0, 0, 0, 0, 0, 0, 0, 0, 0, 0, 0, 0, 0, 0, 0, 0, 0, 0, 0, 0, 0, 0, 0, 0, 0, 0, 0, 0, 0, 0, 0, 0, 1, 1, 1, 1, 1, 1, 1, 1, 1, 1, 1, 1, 1, 1, 1, 1, 1, 1, 1, 1, 1, 1, 1, 1, 1, 1, 1, 1, 1, 1, 1, 1, 1, 1, 1, 1, 1, 1, 1, 1, 1, 1, 1, 1, 1, 1, 1, 1, 1, 1, 1, 1, 1, 1, 1, 1, 1, 1, 1, 1, 1, 1, 1, 1, 1, 1, 1, 1, 1, 1, 1, 2, 2, 2, 2, 2, 2, 2, 2, 2, 2, 2, 2, 2, 2, 2, 2, 2, 2, 2, 2, 2, 2, 2, 2, 2, 2, 2, 2, 2, 2, 2, 2, 2, 2, 2, 2, 2, 2, 2, 2, 2, 2, 2, 2, 2, 2, 2, 2]), 'target_names': array(['class_0', 'class_1', 'class_2'], dtype='<U7')} |
このデータセットの中身はpythonの辞書型になっていますので、取得したい対象のキーを以下のように指定することによって対象の中身(バリュー)を取得できます。
以下は正解ラベルの取得を行なっています。
In[]
1 | data_wine["target"] |
Out[]
1 2 3 4 5 6 7 8 9 | array([0, 0, 0, 0, 0, 0, 0, 0, 0, 0, 0, 0, 0, 0, 0, 0, 0, 0, 0, 0, 0, 0, 0, 0, 0, 0, 0, 0, 0, 0, 0, 0, 0, 0, 0, 0, 0, 0, 0, 0, 0, 0, 0, 0, 0, 0, 0, 0, 0, 0, 0, 0, 0, 0, 0, 0, 0, 0, 0, 1, 1, 1, 1, 1, 1, 1, 1, 1, 1, 1, 1, 1, 1, 1, 1, 1, 1, 1, 1, 1, 1, 1, 1, 1, 1, 1, 1, 1, 1, 1, 1, 1, 1, 1, 1, 1, 1, 1, 1, 1, 1, 1, 1, 1, 1, 1, 1, 1, 1, 1, 1, 1, 1, 1, 1, 1, 1, 1, 1, 1, 1, 1, 1, 1, 1, 1, 1, 1, 1, 1, 2, 2, 2, 2, 2, 2, 2, 2, 2, 2, 2, 2, 2, 2, 2, 2, 2, 2, 2, 2, 2, 2, 2, 2, 2, 2, 2, 2, 2, 2, 2, 2, 2, 2, 2, 2, 2, 2, 2, 2, 2, 2, 2, 2, 2, 2, 2, 2]) |
データの前処理

次に $x$ を特徴量、$y$ を正解ラベルとし前処理を行なっていきます。
まずは正解ラベルの前処理を行います。
元のデータは0, 1, 2 という整数型のデータになっていますが、今回は分類問題のためにこれをカテゴリカル変数に変換します。
In[]
1 2 3 4 | import pandas as pd y_all = pd.DataFrame(data_wine["target"],columns=["target"]) y_all = y_all.replace({0:'class_0', 1:'class_1', 2:'class_2'}) y_all.head() |
Out[]
1 2 3 4 5 6 | target 0 class_0 1 class_0 2 class_0 3 class_0 4 class_0 |
続いて、特徴量の前処理を行います。特徴量の名前は feature_names、値はdataキーに含まれていますのでそれを用います。
In[]
1 2 | X_all = pd.DataFrame(data_wine["data"],columns=data_wine["feature_names"]) X_all.head() |
Out[]

describeメソッドによって、一括で全ての特徴量の統計値の概要を表示できます。
In[]
1 | X_all.describe() |
Out[]

※ 出力結果は一部分のみ掲載しています。
続いて、全てのデータを学習用と評価用に分割します。これにはsklearnの train_test_split メソッドを使います。
学習用データと評価用データの数の割合ですが、今回は2:1とします。
※ 2:1でなければならないというわけではなく、一般的には評価用データ数が全体の2-4割程度にすることが多いです。
In[]
1 2 | from sklearn.model_selection import train_test_split X_train, X_test, y_train, y_test = train_test_split(X_all, y_all, test_size=0.33, random_state=0) |
学習データの特徴量と正解ラベルを1つのデータセットとしてまとめます。
In[]
1 | train = pd.concat([X_train,y_train],axis=1,sort=False) |
続いて、学習用データセットの特徴量と正解ラベルの型を確認します。pandasのinfoメソッドにより全てのカラムの型を確認できます。
In[]
1 | train.info() |
Out[]
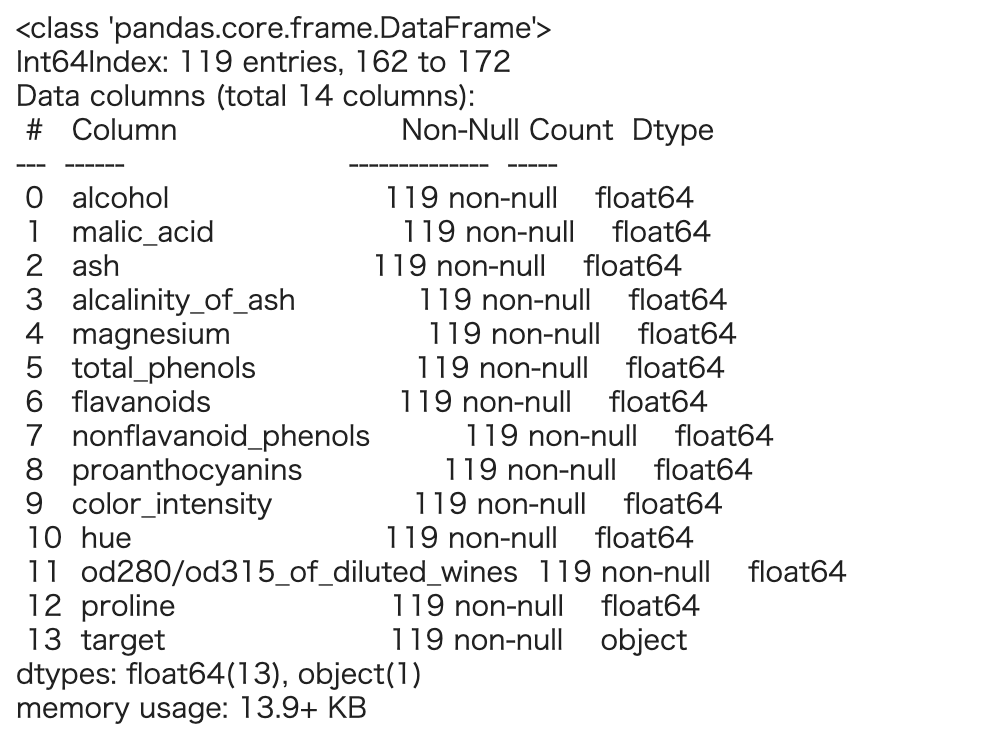
全ての特徴量が浮動小数点数(float型)ということが確認できました。
探索的データ解析(EDA)

続いて、このデータに関して探索的データ解析(EDA)を行なっていきます。
探索的データ解析(EDA)の目的ですが、これから機械学習を使って分類を行なっていきますが、その前に『分類が可能そうかそうでないか』を見極めるのが重要となります。
注意
目的なくデータ全体の平均や分散を算出するだけでは意味がありません。
このデータセットは特徴量が浮動小数点数(float型)で構成されているため、値の大小でクラス分けが大体できれば理想的になります。
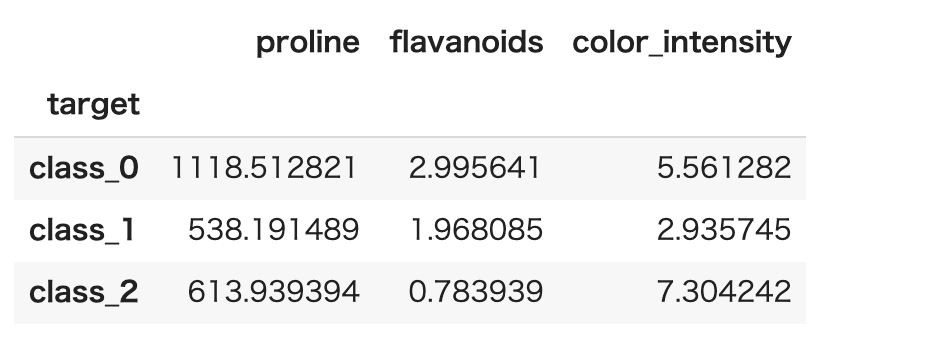
クラス、特徴量ごとの平均をまずは算出してみます。
In[]
1 | train.groupby("target").mean() |
Out[]

※ 出力結果は一部分のみ掲載しています。
特徴量は目で確認するにはそれほどでもない数なので、特徴量ごとに値を確認してみましょう。
そうすると" proline " ," flavanoids " ," color_intensity "あたりの特徴量がクラスごとに差があることが分かります。
In[]
1 | train.groupby("target").mean()[["proline","flavanoids","color_intensity"]] |
Out[]
続いてこれらの特徴量をもう少し詳細に確認していきます。
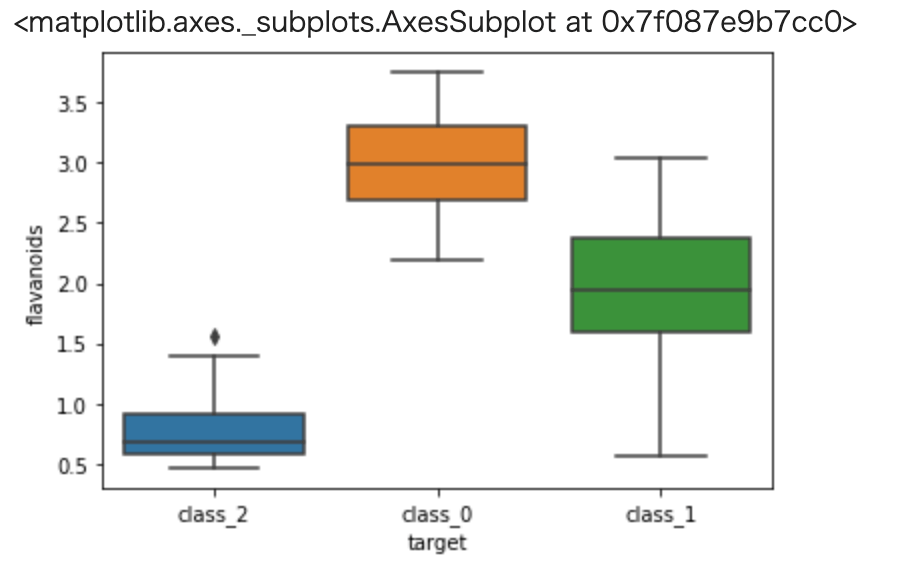
箱ひげ図を用いることによりデータの分布を考慮したクラスごとの違いを確認します。
描画にはseabornライブラリの boxplot メソッドを使うと便利です。
In[]
1 2 | import seaborn as sns sns.boxplot(x='target', y='proline', data=train) |
Out[]

In[]
1 2 | import seaborn as sns sns.boxplot(x='target', y='flavanoids', data=train) |
Out[]
In[]
1 2 | import seaborn as sns sns.boxplot(x='target', y='color_intensity', data=train) |
Out[]
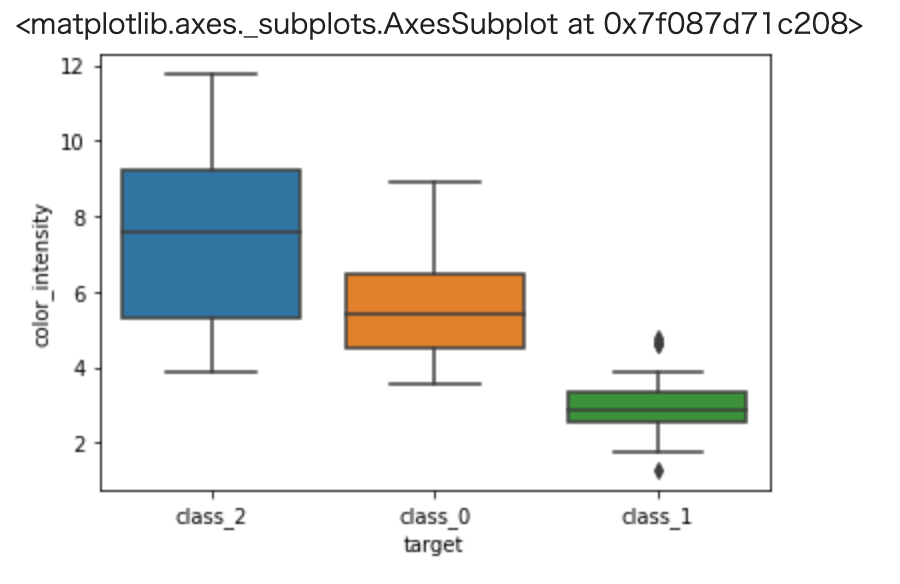
prolineは class_0 と他クラス、color_intensity は class_1 と他クラスを分類するのに有用そうです。
また、flavanoids はこれだけでも全てのクラスを分類できそうですね。(25%-75%点の部分でクラス感の被りが無いですね。)
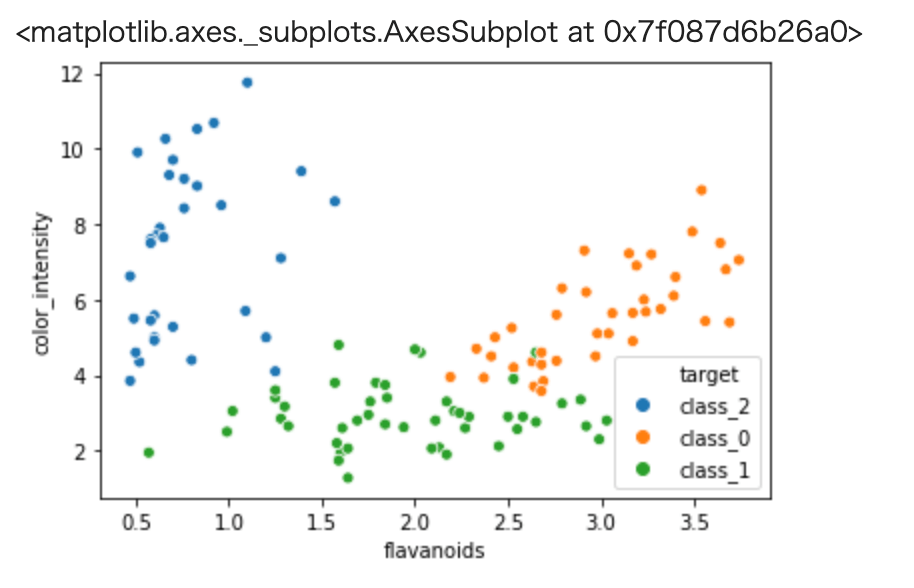
続いて散布図により、2つの特徴量でクラスが上手く分類できそうかを確認してみます。
これも seaborn の scatterplot メソッドを使うと便利です。
seabornの使い方については以下の2つの記事を参考にして下さい。
-
PythonのライブラリSeabornの使い方【前編】 - Tommy blog
続きを見る
-
PythonのライブラリSeabornの使い方【後編】
続きを見る
In[]
1 | sns.scatterplot( x='flavanoids', y='color_intensity',hue="target", data=train) |
Out[]
In[]
1 | sns.scatterplot( x='proline', y='color_intensity',hue="target", data=train) |
Out[]
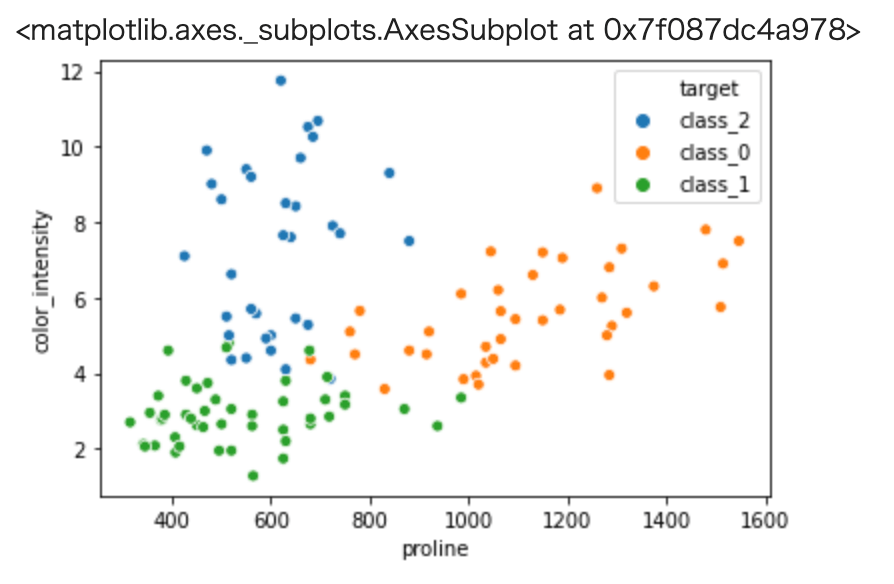
以上から、それぞれのクラスが上手く纏まっており機械学習などの手法によりクラス分類が可能そうという目処がつきました。
よってこれよりクラス分類を行うモデルの作成を行なっていきます。
機械学習予測モデルの作成

機械学習予測モデルの作成を行います。すでに前処理は完了していますので、機械学習モデルのハイパーパラメータ探索から行います。
今回は機械学習モデルとしてランダムフォレスト、ハイパーパラメータ探索としてグリッドサーチを用います。
両方ともsklearnのクラスとして用意されています。
In[]
1 2 | from sklearn.ensemble import RandomForestClassifier from sklearn.model_selection import GridSearchCV |
ランダムフォレストのハイパーパラメータについては色々ありますが、今回は代表的なもののみ取り上げることにします。
ランダムフォレストについては以下の記事を参考にして下さい。
-
【機械学習】ランダムフォレストとは【特徴の解説から実装まで】 - Tommy blog
続きを見る
max_depth(木深さ)、n_estimators(木の数)、min_samples_split(木ノードにおいてそれ以上分割を行うための最少サンプル数)
GridSearchCVの引数について説明しておきます。 scoringについては今回はaccuracyにしております。
不均衡データについて
ただし不均衡データの場合はaccuracyからは変えたほうが良い場合があります。これは別途記事にて解説します。
cvはクロスバリデーションにおけるデータセットの分割数ですが、これは一般的には3-10くらいの場合が多いです。
もちろん分割数が多いほど結果の信頼性が高まりますが、その分計算時間が増大します。
グリッドサーチの手順としては、ハイパーパラメータの候補を作成し、それを元にグリッドサーチのインスタンスを作成、データをフィッティングさせます。
In[]
1 2 3 4 5 6 7 8 9 | param_grid = {"max_depth":[1,2,3,5,7], "n_estimators":[100,200,500],"min_samples_split":[2,3, 5,7] } clf = GridSearchCV(estimator=RandomForestClassifier(random_state=0), param_grid = param_grid, scoring="accuracy", cv = 5, n_jobs = -1) clf.fit(X_train,y_train["target"].values) |
Out[]
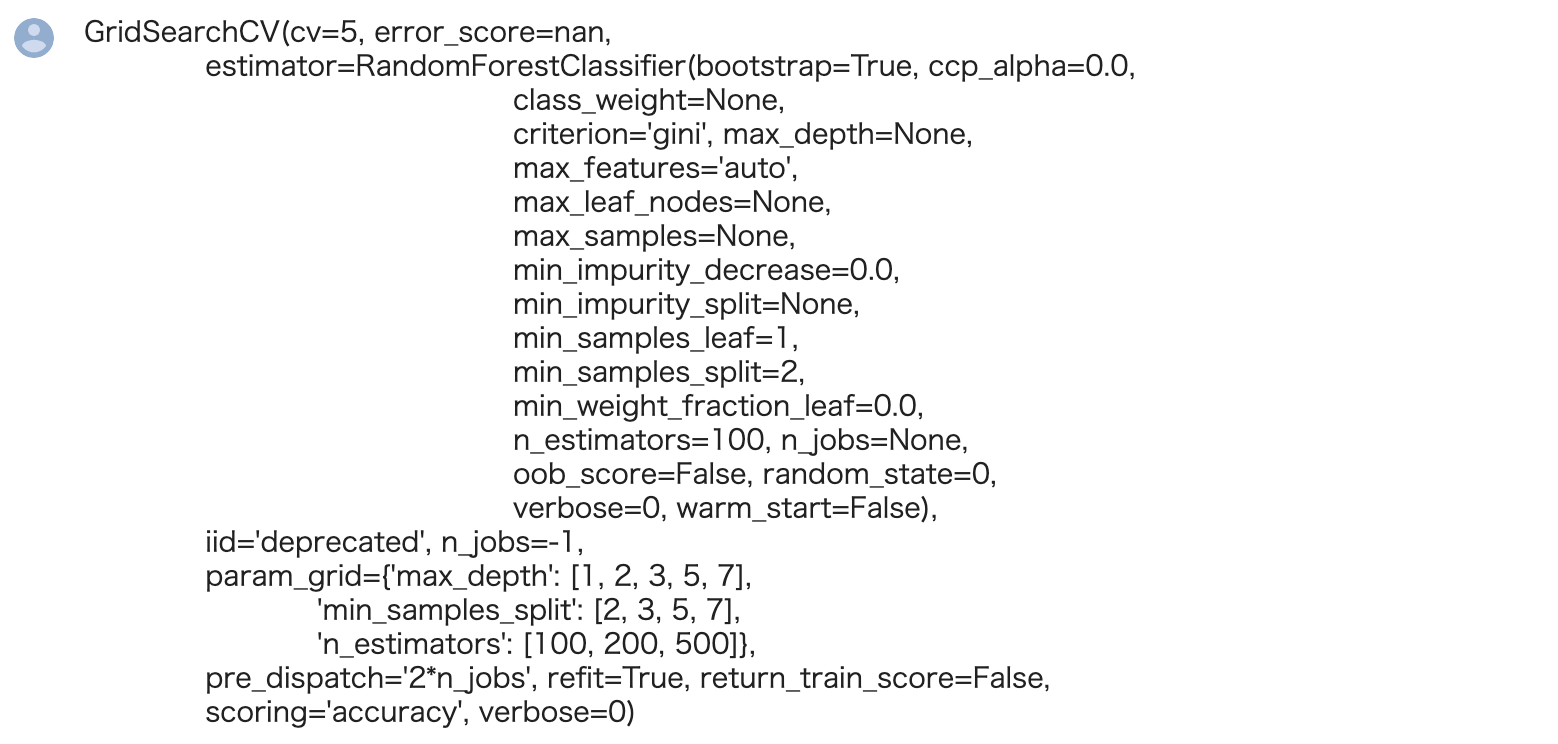
どのハイパーパラメータが最も良い性能を及ぼすかは、フィッティングさせたインスタンス(cld f)の best_params_ メソッドで確認することができます。
best_paras_メソッドは以下を参照しましょう。
-
GridSearchCV — scikit-learn 1.8.0 documentation
続きを見る
In[]
1 | print("Best Model Parameter: ",clf.best_params_) |
Out[]
1 | Best Model Parameter: {'max_depth': 2, 'min_samples_split': 2, 'n_estimators': 100} |
また、このハイパーパラメータを採用した際のモデルは best_estimator_メソッド により作成が可能です。
In[]
1 | clf_best = clf.best_estimator_ #best estimator |
性能評価

続いて、予測と性能評価を行いましょう。
※性能は正解データと予測データがどの程度合致しているかということですが、一般的にはprecision、recall、f1-score、accuracyの4種類があります。
(説明は割愛しますが、本来はデータ分析の背景からこのどれを選ぶかを決定することが多いです。)
今回は元々性能指標として設定していたaccuracyに注目することにしましょう。
accuracy 含め性能評価結果は sklearn の classification_report によって一括で算出することが可能です。
In[]
1 2 3 | from sklearn.metrics import classification_report y_true, y_pred = y_test, clf_best.predict(X_test) print(classification_report(y_true, y_pred)) |
Out[]
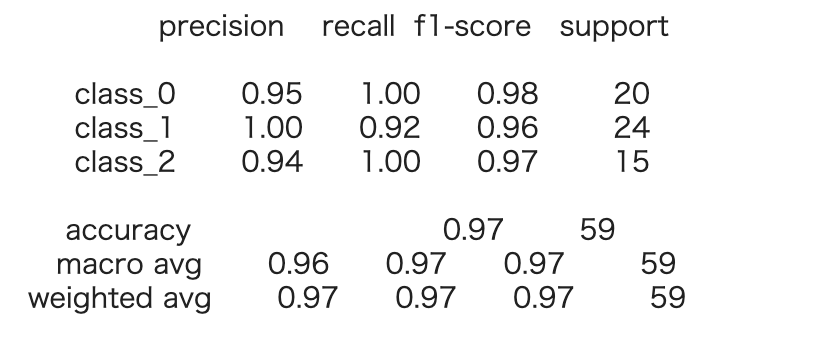
以上の結果から、十分な性能が得られていることが分かります。
まとめ:【教師あり学習】ワインの品質判定を行ってみた

以上がワインのデータセットを用いた教師あり学習の機械学習の練習問題となります。
実際に手を動かされると分かるかと思いますが、それほど難しい内容ではありません。
機械学習を勉強し始めた方の学習の一助になれば幸いです。
今回用いたワインのデータセットを使用して行う、教師なしの機械学習についてもセットで学習しましょう。
-

【教師なし学習】機械学習でワインの品質判定を行ってみよう【scikit-learn】
続きを見る
今回は以上となります。
